In this panel, you can see some basic information about the selected ChIP-seq experiments: name; antibody; cell line and consensus motif binding sites (The number of peak regions obtained in a ChIP-seq experiment, which overlap with a particular consensus motif binding site set). The background colours indicate the cluster colours of the experiments on the venn diagram.
The Venn diagram represents the number of overlaps between the adjusted motif and the peaks of selected ChIP-seq experiments. The sections of sets indicates the number of simultaneous occupancies of peaks on binding sites. The colors of sets are congruent with the information panel above and the dropdown boxes below.
Find the average/median protein positional and occupancy frequency information on a set of given transcription factor binding sites in MotifView.
Browse genomic data of selected experiment in genome browser.
Check the distance distribution of selected experiment as frequency histograms in PairShiftView.
Download genomic data of last selected experiment in BED format.
VennView
placeholder
placeholder
placeholder
placeholder
placeholder
placeholder
placeholder
Experiment name
Antibody
Cell line
Consensus motif binding sites
hs_lymphoblastoid_GM12878_normal_CTCF_SRX150690
CTCF
GM12878
34814
hs_lymphoblastoid_GM12878_normal_ZNF143_SRX150692
ZNF143
GM12878
22672
hs_lymphoblastoid_GM12878_normal_RAD21_SRX100461
RAD21
GM12878
29287
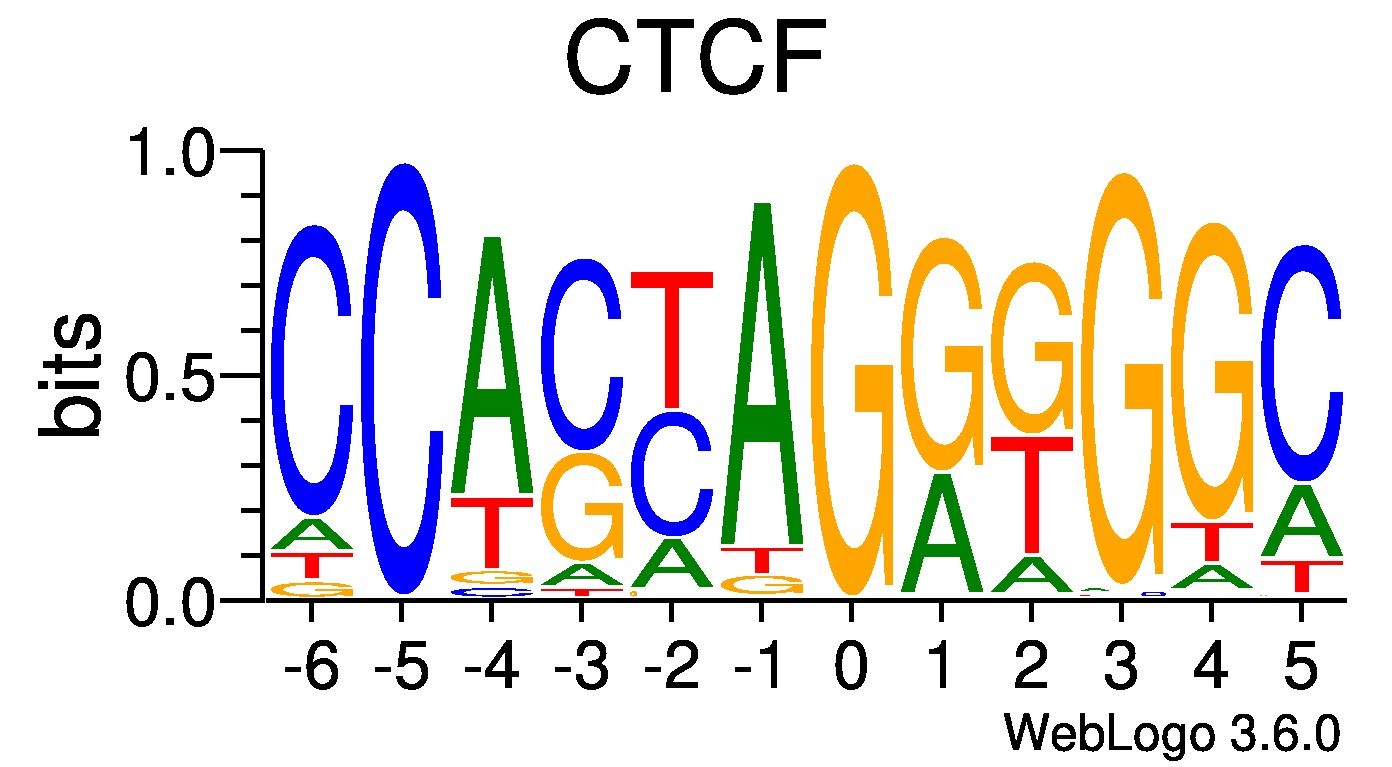
Position weight matrix for selected motif.
The following buttons will navigate you to different views of currently plotted data.
Set a motif:
Minimum overlap number between motifs and peaks of experiment
Select the experiments in the rows of boxes below. Set from left to right: cell type > name of antibody > experiment. Then click on “Resend data” button to refresh the page.
After setting the parameters, click the button below to refresh the page.
Antibody oriented search
In this mode, two or three experiments can be compared as above. Here the seach starts with designating the antibody and the cell type afterwards.
After setting the parameters, click the button below to refresh the page.
VennView
In this mode, two or three experiments can be compared. The values in the sections of the diagram indicates the number of common and specific peaks at a consensus motif binding site.