In this panel, you can see some basic information about the adjusted ChIP-seq experiments: name; antibody; cell line and element number (The number of peak regions obtained in a ChIP-seq experiment, which overlap with a particular consensus motif binding site set). The background colours indicate the histogram colours of the experiments on the plot.
The histograms shows the summit distance distributions of the selected ChIP-seq data (a maximum of 3) related to a motif center.
The PairShiftView allows users to examine the distribution of individual summi- consensus motif distances for three experiments. To smooth the graph, a 5 bp rolling bin is used in the histogram. Each curve represents one ChIP-seq experiment.
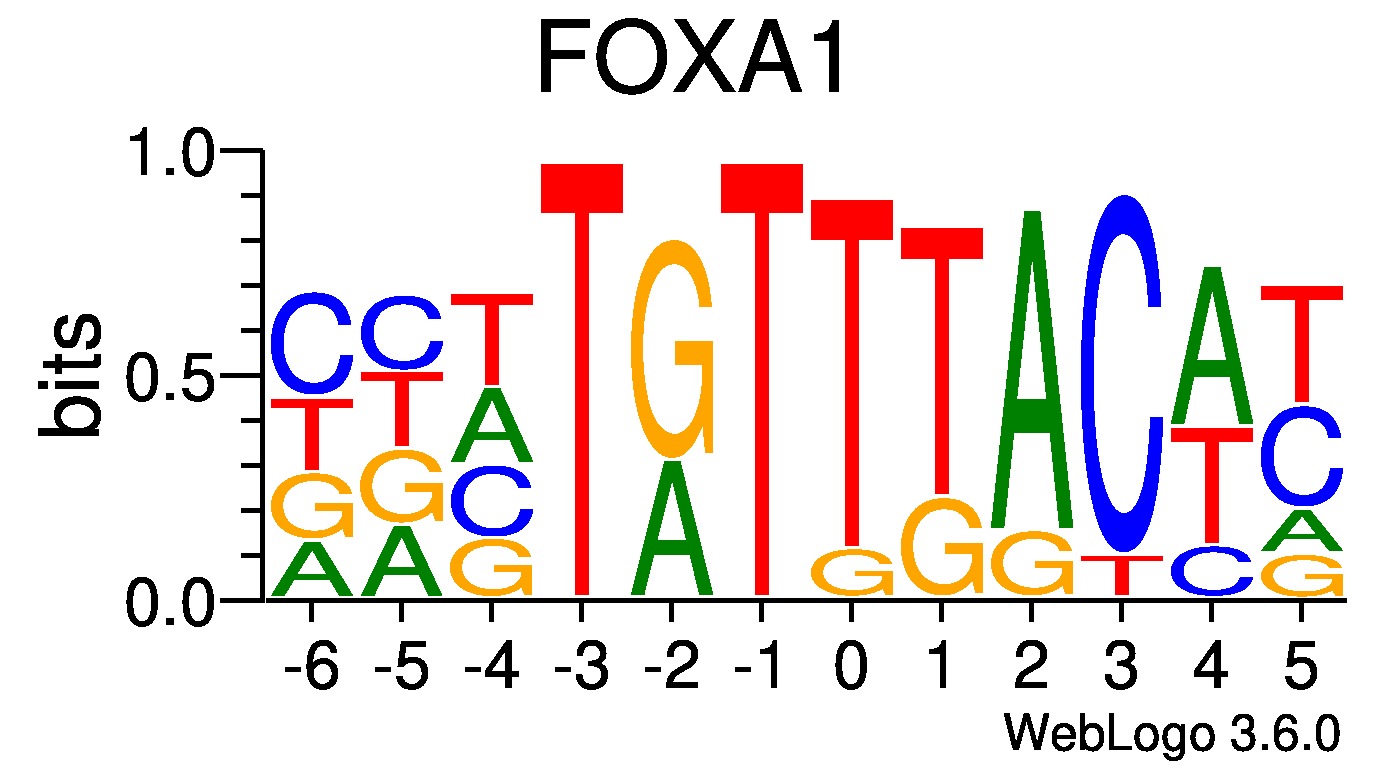
The X axis represents the distance (measured in base pairs) from the middle of the given motif, which is marked as the “0” point. The numbering of the axis is consistent with the position weight matrix below the diagram. The Y axis shows the frequency of summit occurrences at the relative position (at a given base pair) relative to the motif center. In the case of well-defined protein topology with high overlap frequency and close DNA localization, the curve has a bell-like pattern (normal distribution-like).
These buttons navigate you to other view. You can browse the genomic data in genome viewer or you can check the overlap information between selected experiments.
These setting can filter the displayed data. You can set the minimum and maximum element number. After updating the page with “Refresh Page” button, the experiments with out of range values will be vanished from plot.
Select a motif from the dropdown box and click on the ”Refresh Page” button. After updating the page, you can invetigate the occupying proteins on the instances of the adjusted transcription factor motif.
Shift values are shown using the 'FOXA1' motif's center as point zero.
The following buttons will navigate you to different views of currently plotted data.
Minimum overlap number between motifs and peaks of experiment: 100
Set a motif:
Select the experiments in the rows of boxes below. Set from left to right: cell type > name of antibody > experiment. Then click on “Resend data” button to refresh the page.
cell type
antibody
experiment name
In the boxes below set the minimum and maximum distances from the centre of the motif. This is the value of x axis.
distance from motif center maximum
distance from motif center minimum
When the parameters have been set, this button will refresh the page.
If you want to start the selection and filtering the experiment list via antibody name, then use the following panels. Select the experiments in the rows of boxes below. Set from left to right: name of antibody > cell type > experiment. Then click on “Refresh Page” button to refresh the page.
antibody
cell type
experiment name
PairShiftView
In this mode, the frequencies of the different distance values between the motif and peak summit pairs for a given consensus binding site set are displayed in a histogram. To smooth the graph a 5 bp rolling bin was used. No more than three different experiments can be compared. The height of the curves shows the most frequent distance. In the PairShiftView mode, the data range and the consensus motif binding site can be set. An experiment can be also selected and displayed in the ExperimentView.