Select a motif from the dropdown box and click on the ”Refresh Page” button. After updating the page, you can invetigate the occupying proteins on the instances of the adjusted transcription factor motif.
These settings can filter the displayed data. You can set the minimum and maximum standard deviation and/or element number. After updating the page with “Refresh Page” button, the experiments with out of range values will be vanished from scatterplot.
Sort the antibodies according to their names (alphabetically)
Sort the antibodies according to the number of experiments.
These buttons will modify the labels. The antibody names will be replaced with cell type names. Following the logic of the previous buttons, the experiment can be sorted by name of the cell line or the number of their occurrences.
In this panel, you can see a list of proteins which had ChIP-seq signal in proximity to instances of the adjusted motif. The numbers next to the protein names indicate the number of (with the motif) corresponding experiments which were targeted the given protein and had ChIP-seq summits near to the motif instances. These numbers are equal with the number of dots on scatterplot. The colours of squares also congruent with the fill colour of dots. Clicking on the name of a factor hide/show its dots on scatterplot.
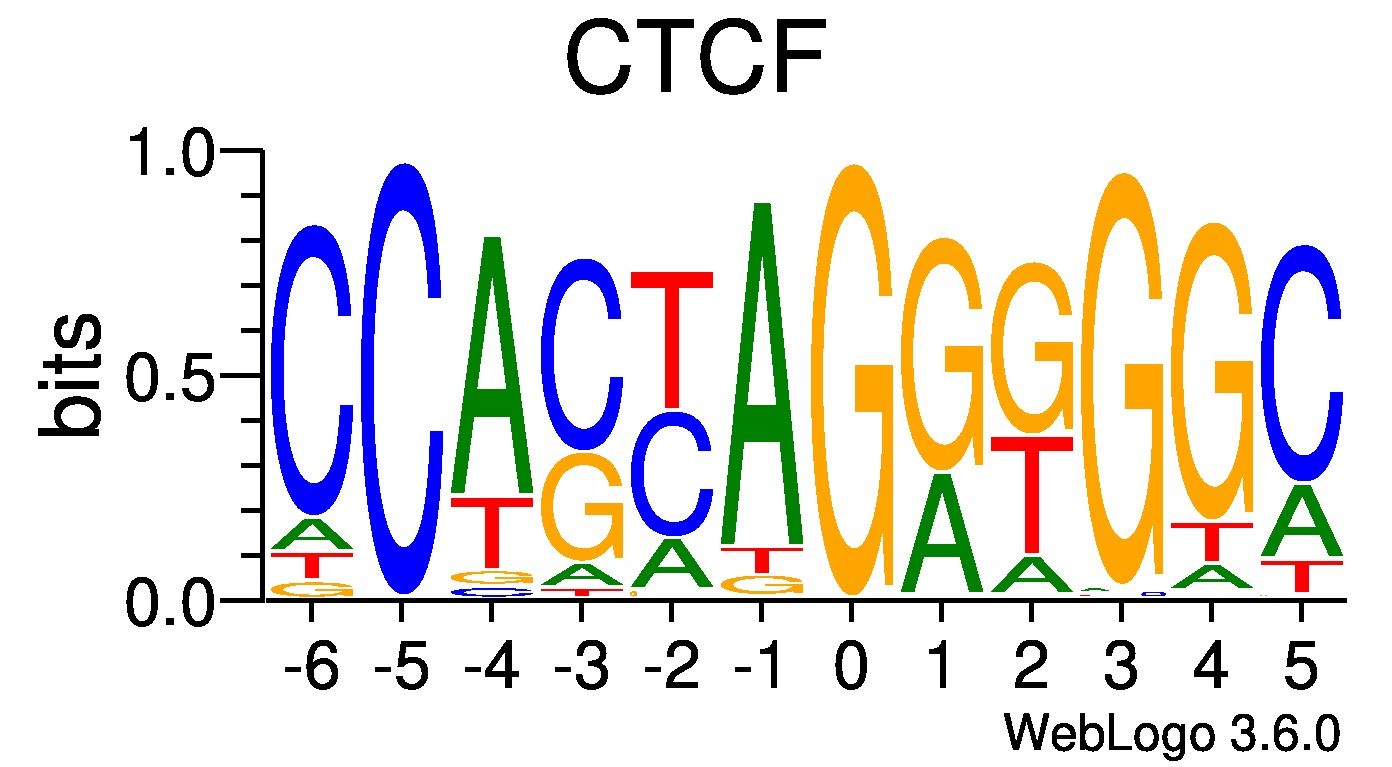
Consensus motif: CTCF
Every dot on the scatterplot represent one ChIP-seq experiment. The dots are colored according to the type of target protein. X axis: A point are placed according to the average position of summits of the experiment relative to the motif centers. The Y axis is adjustable, you can choose to display the number of summit-motif overlaps or the standard deviation of summit positions (with buttons below ”Set Y value”). If you hover the cursor on a given dot, a tool-tip will appear, which gives information about the ChIP-seq experiment, including the name of the experiment, cell type, target protein, and quantified information about summit positions (average/median distance, standard deviation of distances, and overlap number). You can click on experiments (maximum 3) to investigate them in other views or download their corresponding data. The selected experiments are listed below the scatterplot.
The Y axis is adjustable, you can choose to display the element number or the standard deviation of summit positions (with buttons below ”Set Y value”). Element number means the number of peak regions obtained in a ChIP-seq experiment, which overlap with a particular consensus motif binding site set.
The dots are placed depending on the relation between the positioning information and the adjusted motif center. The X axis represents the distance from the center of the adjusted JASPAR CORE motif which can be seen on the right bottom corner of scatterplot. The “0” point is the middle base pair of the motif. The distance is measured in base pairs.
If you click on maximum 3 points on scatterplot, information about the corresponding ChIP-seq experiments will appear. This information consists of the cell type origin, the antibody name and the element number (The number of peak regions obtained in a ChIP-seq experiment, which overlap with a particular consensus motif binding site set). If you click on these information boxes, you will be navigated to the Experiment view. You can read detail about the selected experiments in this view. The selected experiments can be investigated in other views, if you click on the appearing boxes under the scatterplot. The selections can be vanished with „Clear all selected” button.
If you want to modify the list of selected experiments, you can vanish it with this button.
Position weight matrix for selected motif.
Set a motif:
This form will change the maximum and minimum average deviation value of the dots shown. Try using integers please.
Minimum standard deviation
The following buttons change the display of data. With the following buttons you can change the Y value.
X value: average distance. Set Y value.
X value: average of average distances. Set Y value.
Plot options
Switch the legend to antibody (default view) and sort by using the two buttons below.
Choose a sorting method
Switch the legend to cell line and sort by using the two buttons below.
MotifView
In this mode, the average distances between the peak of the reads obtained in a ChIP-seq experiment and a given consensus motif on a scatterplot graph is visualized. Each scatter represents an experiments
The displayed data can be filtered by the number of overlapping peaks (element number) or by the standard deviation. Data can be also displayed based on the used antibody or cell type. Averages of experiments
After selecting maximum three experiments, links are available to switch to other views.