The manuscript describing this database can be found by following these links:
Motif oriented high-resolution analysis of ChIP-seq data reveals the topological order of CTCF and cohesin proteins on DNA G Nagy, E Czipa, L Steiner, T Nagy, S Pongor, L Nagy… - BMC genomics, 2016
ChIPSummitDB: A ChIP-seq-based database of human transcription factor binding sites and the topological arrangements of the proteins bound to them. E Czipa, M Schiller, T Nagy, L Kontra, L Steiner, J Koller, O Palne-Szen, E Barta - Database, 2020
ChIPSummitDB is a comprehensive database of transcription factor binding sites verified by human ChIP-seq experiments and the distances (positions) of the binding sites relative to the peak summits defined by the ChIP-seq reads. The database is a collection of the genomic positions of the consensus binding sites of each analyzed TF (group). Furthermore, the database displays the overlapping peaks for these consensus binding site motifs. The database can predict the topological relationships of different proteins at a given consensus binding site by measuring the motif center – peak summit distances.
Data can be displayed using the following views:
ExperimentView shows detailed data for each ChIP-seq experiment downloaded from the SRA database.
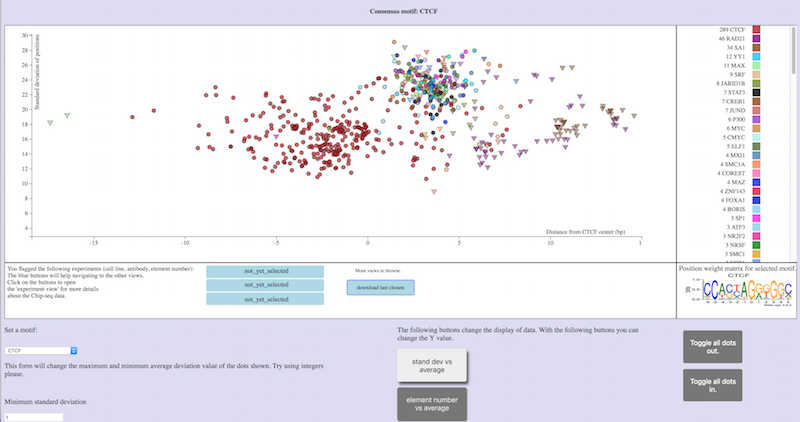
MotifViewshows the average ChIP-seq peak summit vs. motif center distances between each consensus motif binding site set and the ChIP-seq experiments using a scatterplot graph. The displayed values can be filtered by different parameters.
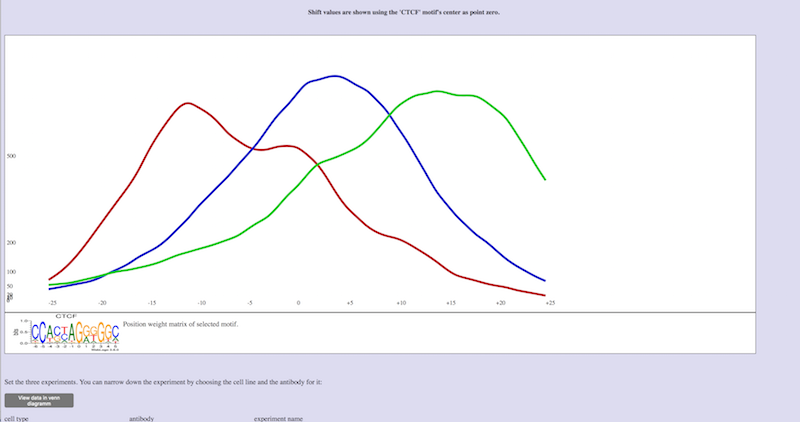
PairShiftView shows a distribution graph of the distance between the peak summit and the center of the motif for a maximum of three selected ChIP-seq experiments.
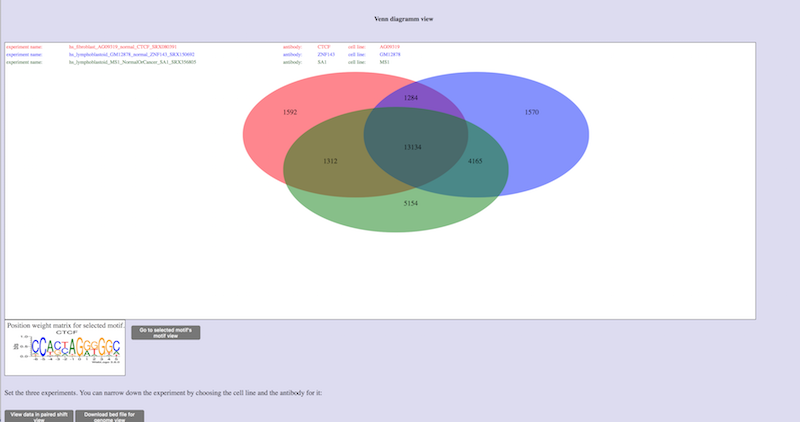
VennDiagramView shows the numbers of common peaks at a given consensus binding site set for a maximum of three ChIP-seq experiments using a Venn diagram.
GenomeView visualizes the consensus binding site sets and the whole or overlapping peak sets in the JBrowse genome browser.
dbSNPViewThis view helps you to see variations and overlapping regulatory motifs.
Different peak sets can be downloaded in “bedfile” format.
In this mode, the average distances between the peak of the reads obtained in a ChIP-seq experiment and a given consensus motif on a scatterplot graph are visualized. Each scatter represents an experiment. Circles represent transcription factors with defined binding sites, while triangles represent co-factors and other indirectly bound proteins. Different colors indicate the antibody used in the immunoprecipitation. The X-axis shows the average distances between peak summits and the center of the binding sites for all overlapping peaks. The Y-axis shows either the number of overlapping peaks (elements) or, in default mode, the standard deviation of the shift values (distances) between the peak summits and motif centers. This scatterplot representation is available for all consensus binding motif sets.
The displayed data can be filtered by the number of overlapping peaks (element number) or by the standard deviation. Data can also be displayed based on the antibody or cell type. Averages of experiments obtained by the same antibody in different experiments can also be calculated and displayed.
After selecting a maximum of three experiments, links are available to switch to other views.
In this mode, the frequencies of the different distance values between the motif and peak summit pairs for a given consensus binding site set are displayed in a histogram. To smooth the graph, a 5 bp rolling bin was used. No more than three different experiments can be compared. The maximum value of the curves shows the most frequent distance, which is the same as the value shown on the X-axis in the MotifView.
In the PairShiftView mode, the data range and the consensus motif binding site set can be changed. There is also a possibility to select an experiment and see it in the ExperimentView.
In this mode, two or three experiments can be compared. The values in the sections of the diagram indicate the number of overlapping peaks at the consensus motif binding sites for a given motif. One TFBS in a genome (among the thousands defined in the Consensus motif binding site set) can overlap (between 50bp at both sides) any of the two or all three experiments examined in this view. In the Venn diagram, we count these occurrences. In this view, the consensus motif and the experiment can be selected.
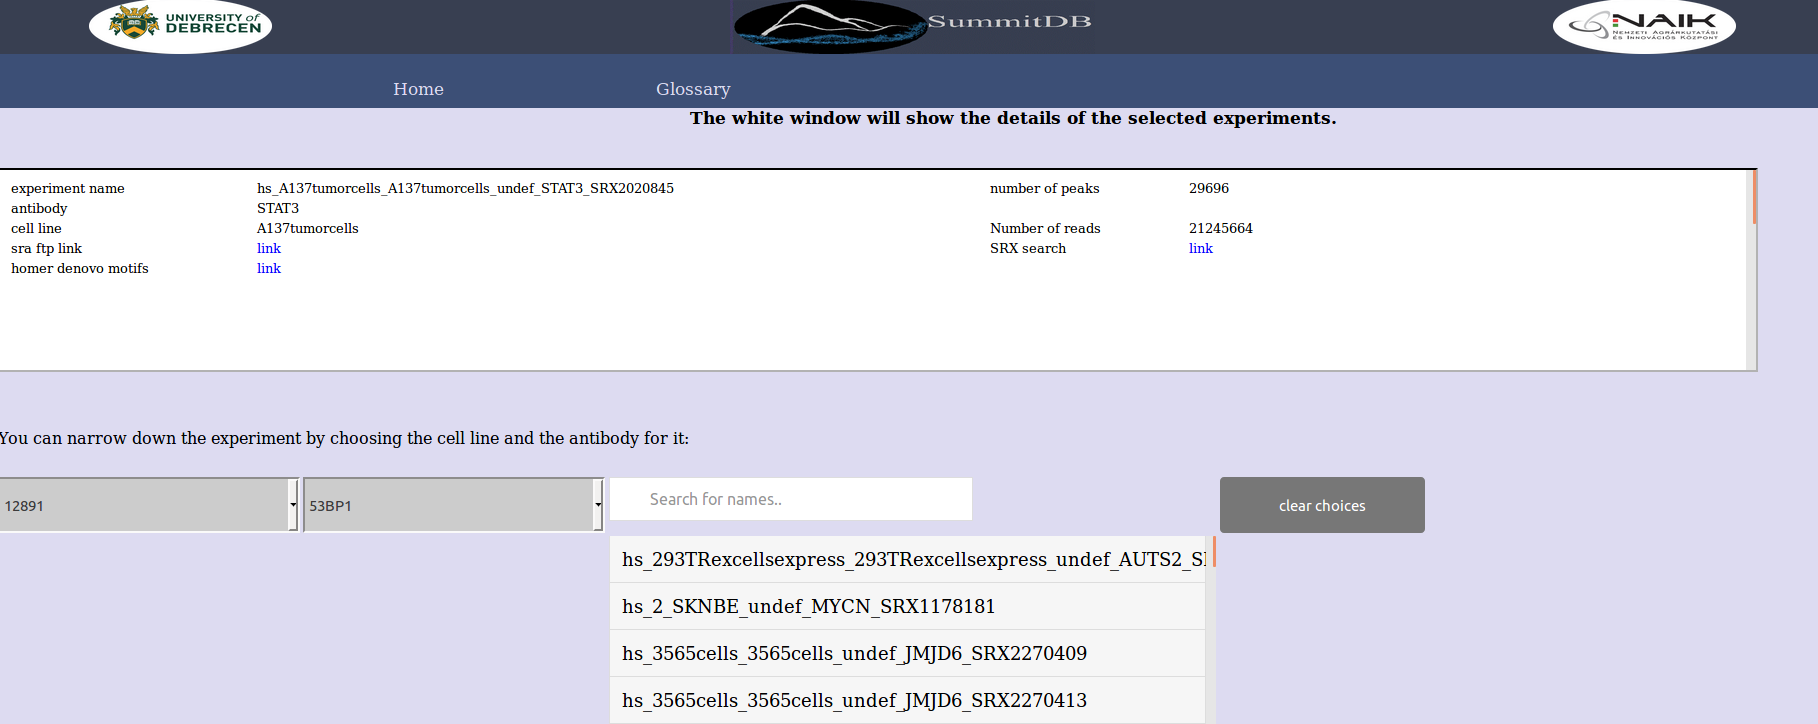
In this mode, the details of any ChIP-seq experiment can be seen. The displayed information includes the SRA links, the number of reads, the antibody used, the mapped reads, and the number of peaks. The result of the HOMER de novo motif prediction can also be seen. Experiments incorporated into ChIPSummitDB can be searched for display.
This view helps you to see variations and overlapping regulatory motifs based on dbSNP.